Hold shift while clicking to graph multiple stations
Loading vectors. Please Wait...
-
IFR
AMP
1cm/yr Horizontal
1cm/yr vertical
GNSS:
GNSS+borehole tilt:
0
cm/yr
Volcano
Relative Orbit
Mode
Next Observation
About Volcano Deformation
Mass movement underneath a volcano can result in deformation of the surface of the Earth. As magma rises from
depth, the surface of the Earth is pushed up slightly, as magma migrates or erupts, the surface lowers; similar
to the up and down of the chest when breathing. These signals are often subtle, on the order of a few
millimeters to centimeters, but can affect areas with a diameter of many kilometers around the volcano. Notably,
the deformation depends on (1) the volume of the material, (2) its depth, (3) and the first order geometry of
the mass (for instance spherical or ellipsoidal). In principle, the more material intrudes at shallower depths,
the larger the deformation signal and the smaller the radius around the volcano that is affected by the
deformation).
At AVO, we use several techniques to measure such deformation signals: (1) Global Navigation Satellite Systems
(GNSS, which includes GPS); (2) borehole tiltmeters; and (3) Interferometric Synthetic Aperture Radar (InSAR).
The first two require instrumentation on the ground. GNSS instruments measure how the position of a point
changes at a precision of just a few millimeters on time scales of seconds to years. Tiltmeters measure the
change in angle of the ground surface at fractions of a degree, which they resolve over seconds to days. SAR is
a satellite-based instrument that emits and records the intensity and phase of electromagnetic waves that bounce
off the surface of the Earth back to the satellite. Two or more of such images, currently about 6-12 days apart,
can be compared to create a deformation map of the Earth’s surface, which we call an interferogram or a time
series of interferograms.
Alaska Volcanoes deform on a range of scales, up to ~10 cm/yr at Okmok since its last eruption in 2008 (as shown
in the figure below), to a few microradians, detectable only on tiltmeters at Shishaldin during its 2019-2020
activity (We invite you to find those signals using the interface).
About this Interface
This display consists of two parts: (1) the map component and (2) a time series display
(that opens when you click on a station). The tabs on top of the map display provide a quick link to volcanoes
that are monitored with ground based geodetic instruments.
Map
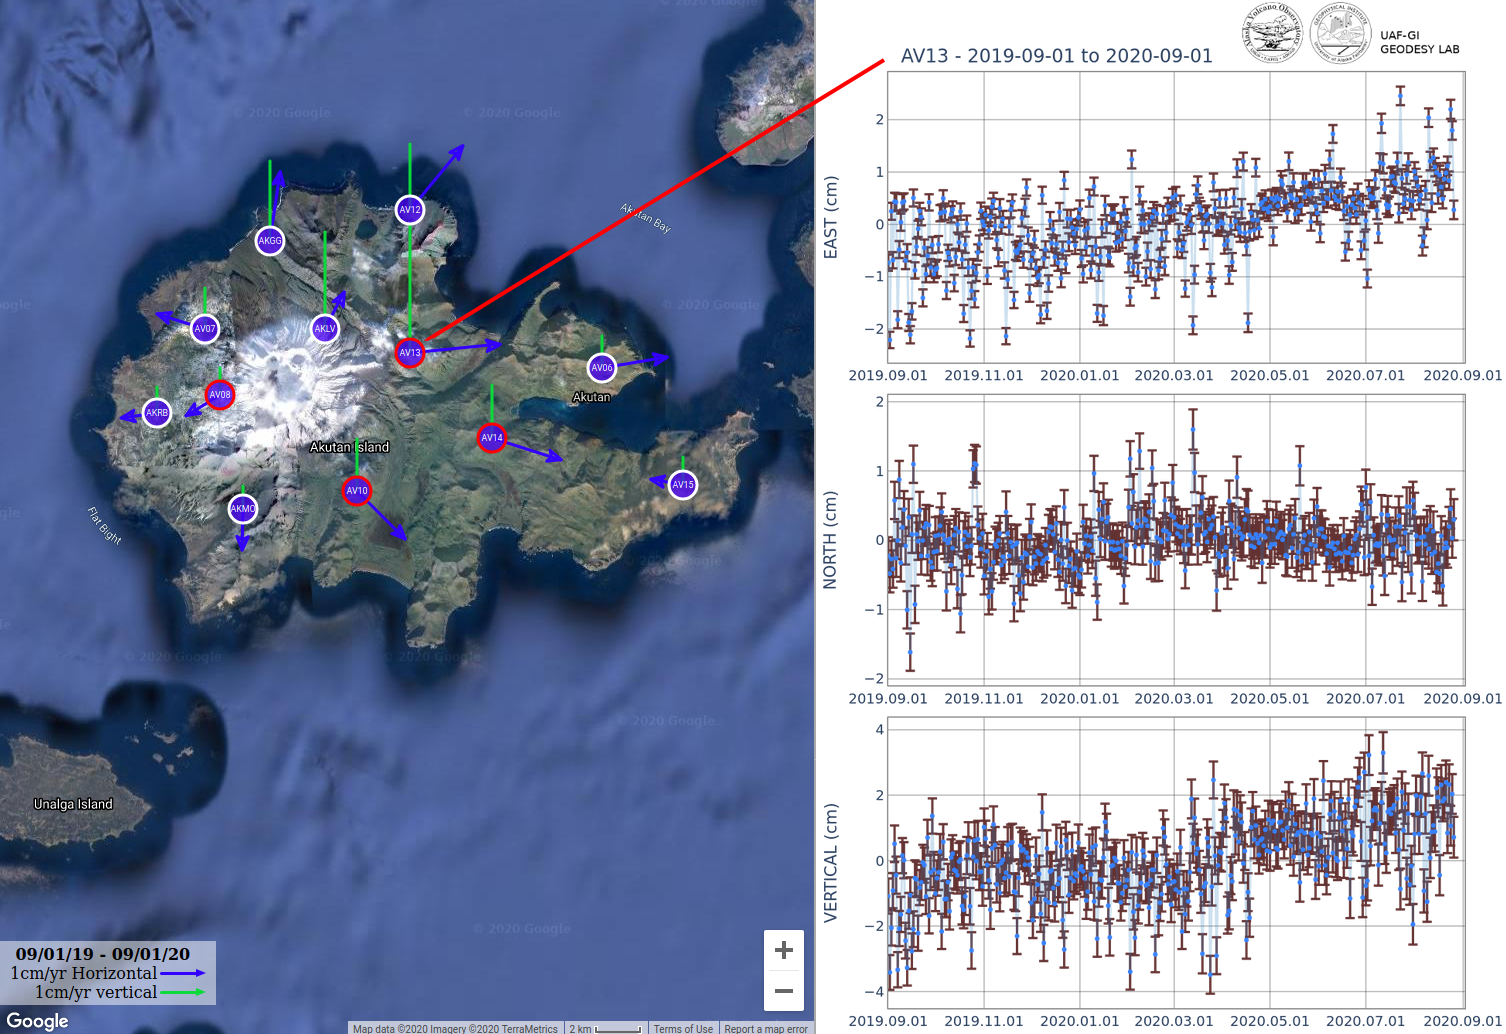
The map interface displays ground stations as blue circles. White circle edges denote GNSS-only installations,
red circle edges indicate GNSS and borehole tilt stations. The arrows attached to the stations indicate the
station velocity (cm/yr); the time interval over which this is calculated is indicated in the legend. All this
is marked in the figure below, which shows that the GNSS stations at Akutan volcano from October 14, 2019 to
October 14, 2020 all move away from the volcano (blue vectors) and stations closer to the edifice move up (green
vectors).
Time Series
After selecting a site on the map interface, its time series will be loaded. The time series are organized in
east, north and vertical motion, each appropriately labeled. Each dot represents the position estimate for a
single day. The bars attached to each point indicate the uncertainties in the position (the position is an
estimate that is based on several assumptions, not a direct measurement!). If we have very little data or any
given day (say, due to telemetry issues), the error bars will be quite large. Occasionally there are outliers -
points that are very far away from the days before and after. These are generally due to snow & ice on the
antenna, resulting in gaps in the winters. The last few days for each time series are marked orange. This
indicates that these are temporary solutions based on rapid estimates for the GNSS satellite orbits. Final orbit
products are usually available with an approximately 2-week delay (it takes time to estimate these), after which
we re-estimate the station position and the dot turns blue. As these dots (or days) of positions accumulate, we
see the subtle motion of the site on the millimeter to centimeter scale: the sites move not just because of
volcanic activity, but also because of tectonics, seasonal snow and other processes.
Being able to look at the time series for each station is useful to explore how the velocities that we show on
the map represent the motion of the site. It is important to know that the velocities are simply the long-term
motion of a time series over a certain time period. We provide several presets for time frames that may be of
interest (default is 1 year), or you can select your own time frame (custom). In the example above, we show that
the 1-year time series at AV13 between September 1, 2019, and September 1, 2020 shows a deviation from the
background trend beginning in about May 2020: the east component shows an eastward trend, the vertical component
shows upward motion. This is reflected in the vectors on the map. Note that the vectors are recalculated based
on the time frame you choose. Very short time frames (less than a few months) will often result in very large
velocities that are not very meaningful.
Baselines
For GNSS stations around volcanoes it is useful to display velocities and timeseries relative to a “base
station” that is far enough away from the volcano to not be very much affected by magmatic processes, but close
enough to be affected by similar tectonic and other regional effects. When we plot baselines, we effectively
remove the motion at the base station from the stations at the volcano. The timeseries plot indicates the 4
letter ID of the base station used.
Tilt Time Series
Some markers on the map have a red circle around them. These are locations where both a GNSS instrument and a
borehole tiltmeter are installed. For these stations, the GNSS time series is automatically loaded, but the tilt
time series can be selected through the “Tilt” tab. Tiltmeters measure the change in slope and are much more
sensitive to deformation than GNSS.